
The short version
In the 1990s, the US Environmental Protection Agency used Waquoit Bay as a test case for a new way of weighing threats to a whole watershed. Scientists and managers listed everything that could harm the bay, from pesticides to boating to overfishing. Nitrogen came out on top. As houses replaced woods, the nitrogen reaching the bay more than doubled, eelgrass shrank from most of the bay floor to a sliver, and scallop harvests collapsed. The report gives managers a rough target for how far nitrogen would have to fall to bring eelgrass back.
What the researchers did
A workgroup led by the Waquoit Bay National Estuarine Research Reserve and EPA’s New England office, with NOAA’s fisheries lab in Woods Hole and the Boston University Marine Program, held a public meeting and agreed on a goal: restore water quality and habitat so the bay supports healthy fish and shellfish. They then worked through EPA’s ecological risk assessment process step by step.
- They listed six human-caused stressors: chemical pollution, altered freshwater flow, nutrient enrichment, physical habitat change, fishing and shellfishing, and pathogens. They ranked them against valued resources such as eelgrass, scallops, finfish, herring runs and nesting birds.
- Nutrients ranked first, so they focused on nitrogen and on two measures of harm: eelgrass cover and scallop abundance.
- They used a nitrogen loading model to track nitrogen from rain, septic systems and fertilizer through the watershed to the shore. They checked it against groundwater sampled around the bay, and used aerial photos to rebuild loads back to the late 1930s.
What they found
- Septic systems are the norm. More than 85% of homes in the watershed use on-site septic systems, and the sandy soils let much of their nitrogen reach groundwater.
- Loads vary widely around the bay. Measured nitrogen loads ranged from 433 kg a year into Sage Lot Pond to 9,879 kg a year into the Quashnet River. All of Waquoit Bay received just over 26,500 kg a year.
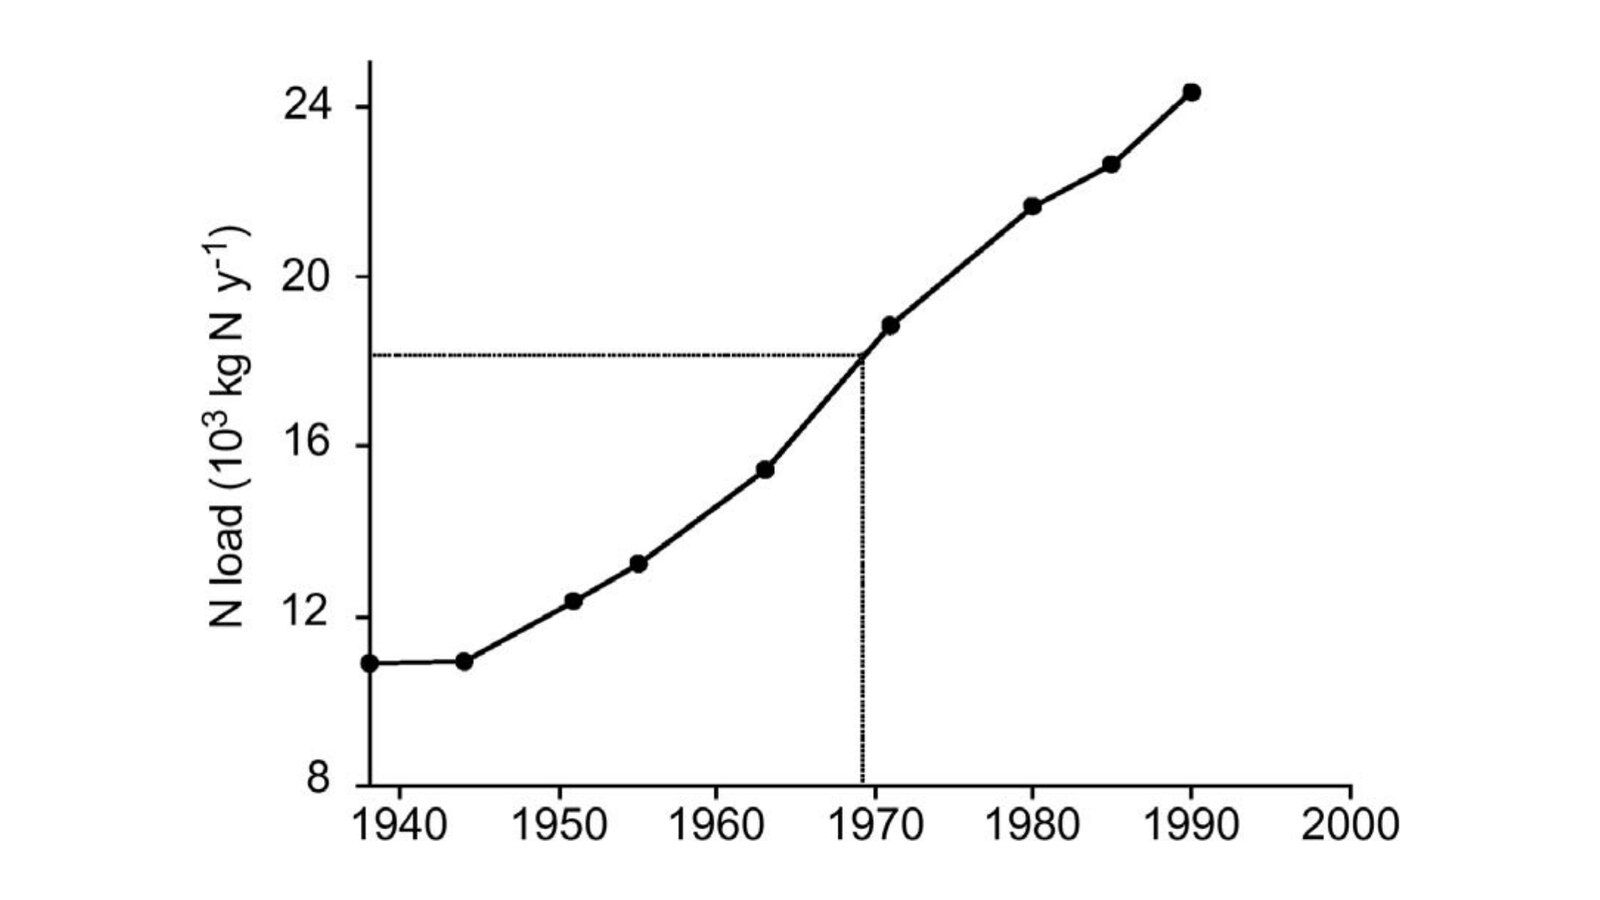
- Loads more than doubled. The modeled nitrogen load to the watershed rose from slightly more than 10,000 kg a year in the late 1930s to more than 24,000 kg a year in 1990.
- Wastewater leads at the shore. Rain and air pollution put the most nitrogen on the land, but forests and soils trap almost 90% of it, compared with only 65% of wastewater nitrogen. Using 1990 data, wastewater supplied 43% of the nitrogen reaching the bay. Managing fertilizer could cut loads by 19% at most.
- Eelgrass has a tipping point. Eelgrass covered 60% of the bay in 1955 and less than 10% in 1990. Comparing loads with eelgrass loss, the authors conclude that
eelgrass disappears once nitrogen loads reach 20 kg/ha/yr
(U.S. EPA, 2002). - Scallops followed the eelgrass. Over the same years, scallop harvests fell from more than 200,000 liters a year to well under 20,000.
- Not every species lost. Soft-shell clams and quahogs grew faster where nitrogen was higher. The two most common small fish, Atlantic silversides and mummichogs, showed no response.
What it means for Waquoit Bay today
This report was one of the first official documents to tie Waquoit Bay’s lost eelgrass and scallops directly to nitrogen from homes in the watershed. It also put a number on recovery. The authors estimated that bringing eelgrass back to about 30% of the bay would mean cutting the nitrogen load to roughly 18,000 kg a year. Because wastewater was the largest source reaching the water, they pointed to septic nitrogen as the higher priority over fertilizer.
Later work by the Massachusetts Estuaries Project refined these numbers into the legal limits that Falmouth and Mashpee now plan around (see our explainer on the state’s threshold report). For the science behind the source estimates, see where Waquoit Bay’s nitrogen comes from.
Read the report
U.S. Environmental Protection Agency. (2002). Waquoit Bay Watershed Ecological Risk Assessment: The effect of land-derived nitrogen loads on estuarine eutrophication (EPA/600/R-02/079). National Center for Environmental Assessment, Office of Research and Development, Washington, DC. Authors: J. L. Bowen, D. Dow, V. B. Serveiss, I. Valiela and L. Rao. https://assessments.epa.gov/risk/document/&deid=15221
License: This is a US federal government report and is in the public domain. The full PDF below is the copy in CPWB’s research files, reproduced unmodified. The card image is Figure 7-2 from the report (public domain, US Government work).
Drafted with AI assistance from the linked source.


